Discover the world of Big Data with us!
Info-Syst is a full-cycle technology company building advanced big data solutions. We are proud to build strategies and processes that help our clients achieve their goals by getting the power of artificial intelligence and data science into their businesses.
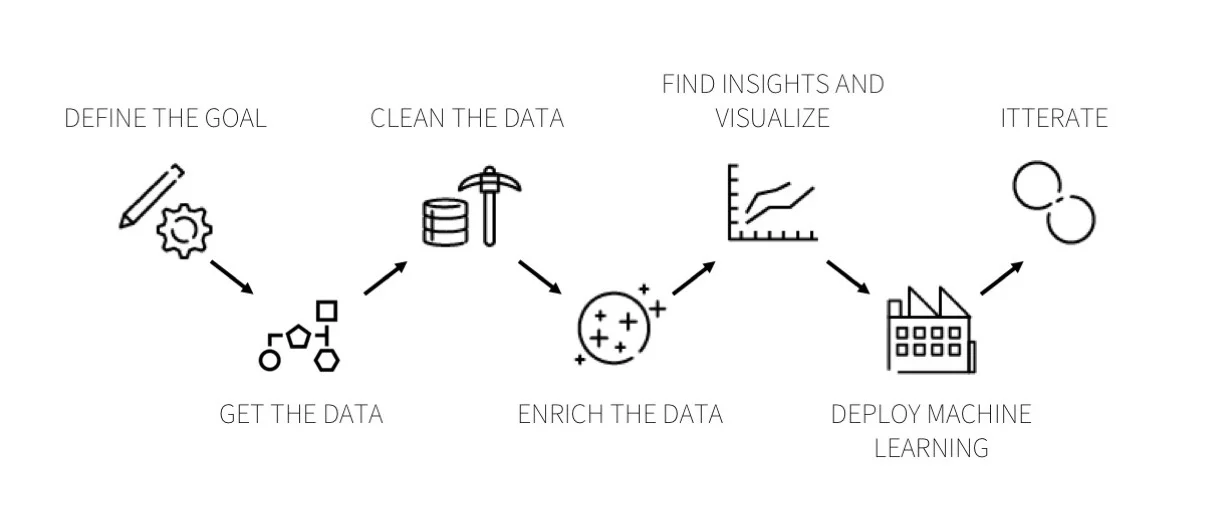
- Domain Understanding
- Data Collection,Understanding and Wrangling
- Modelling & Visualization
- Deployment
Services
We provide Big Data Solutions for businesses in a variety of sectors, including technology, healthcare and agriculture. Our services help clients make data-driven decisions. We also offer customized software development in these fields.
Data Analytics
We use Data Analytics in examining raw data to give information.We apply algorithmic processes to derive insights and meaningful correlations between data sets. We use data analytics in several industries to allow organizations and companies to make better decisions as well as verify and disprove existing theories or models.
ML & NLP
Machine learning is a method of data analysis that automates analytical model building.Natural language processing (NLP) helps computers understand, interpret and manipulate human language. We are the first company in Malawi to apply ML & NPL to healthcare and telecommunications.
Predictive Analytics
Our approach to predictive analytics is using data, statistical algorithms and machine learning techniques to identify the likelihood of future outcomes based on historical data. Our goal is to go beyond knowing what has happened to providing a best assessment of what will happen in the future.We use predictive analytics in detecting fraud, optimizing marketing campaigns,improving operations and reducing risk .
Data Visualization
Data visualization is the graphical representation of information and data. By using visual elements like charts, graphs, and maps, data visualization tools provide an accessible way to see and understand trends, outliers, and patterns in data. With interactive visualization,we take the concept a step further by using technology to drill down into charts and graphs for more detail, interactively changing what data we see and how it’s processed.
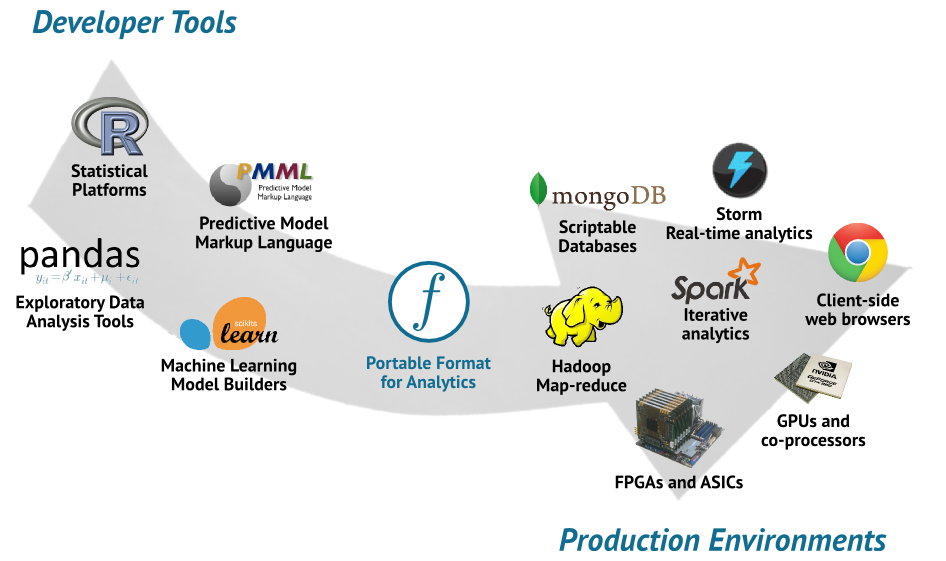
We use the best technologies available and we are always looking for new ones. These tools and technologies generally fall into these categories: data storage, exploratory data analysis, data modelling and data visualization. These are some of the tools and technologies we commonly use.


Contact Us
As a software company we specialize in data science & applications of artifical intelligence in technology, healthcare and agriculture. We also strongly believe in helping organizations to make correct decisions timely because of getting valuable insights from their data.
Address
Post Dot Net X11 Crossroads, Lilongwe, Malawi Corporate Box E25 Bingu Stadium, Lilongwe